Monitoring Tomcat is an important part of ensuring a stable and reliable application environment. Without proper monitoring, it’s hard to track down performance issues and security threats as they arise. To ensure your applications hosted on Tomcat remain healthy, it’s important to implement an effective monitoring strategy that covers all the essential metrics.
In this blog post, we’ll explain why monitoring Tomcat is important and provide a comprehensive list of the metrics you should monitor in order to get the most out of your application server.
Tomcat is an open-source web server and servlet container for Java code. It powers many of today’s most popular applications, such as Apache Solr and Apache Lucene. As such, it’s important to ensure that any applications relying on Tomcat stay up and running at all times.
Monitoring Tomcat can help you achieve this goal by giving you the data you need to identify performance bottlenecks, detect security threats and troubleshoot problems quickly. It also helps you keep track of your resource utilization so that you can better plan for future needs or adjust your infrastructure accordingly.
When monitoring Tomcat, there are several key metrics that should be tracked in order to ensure the best performance:
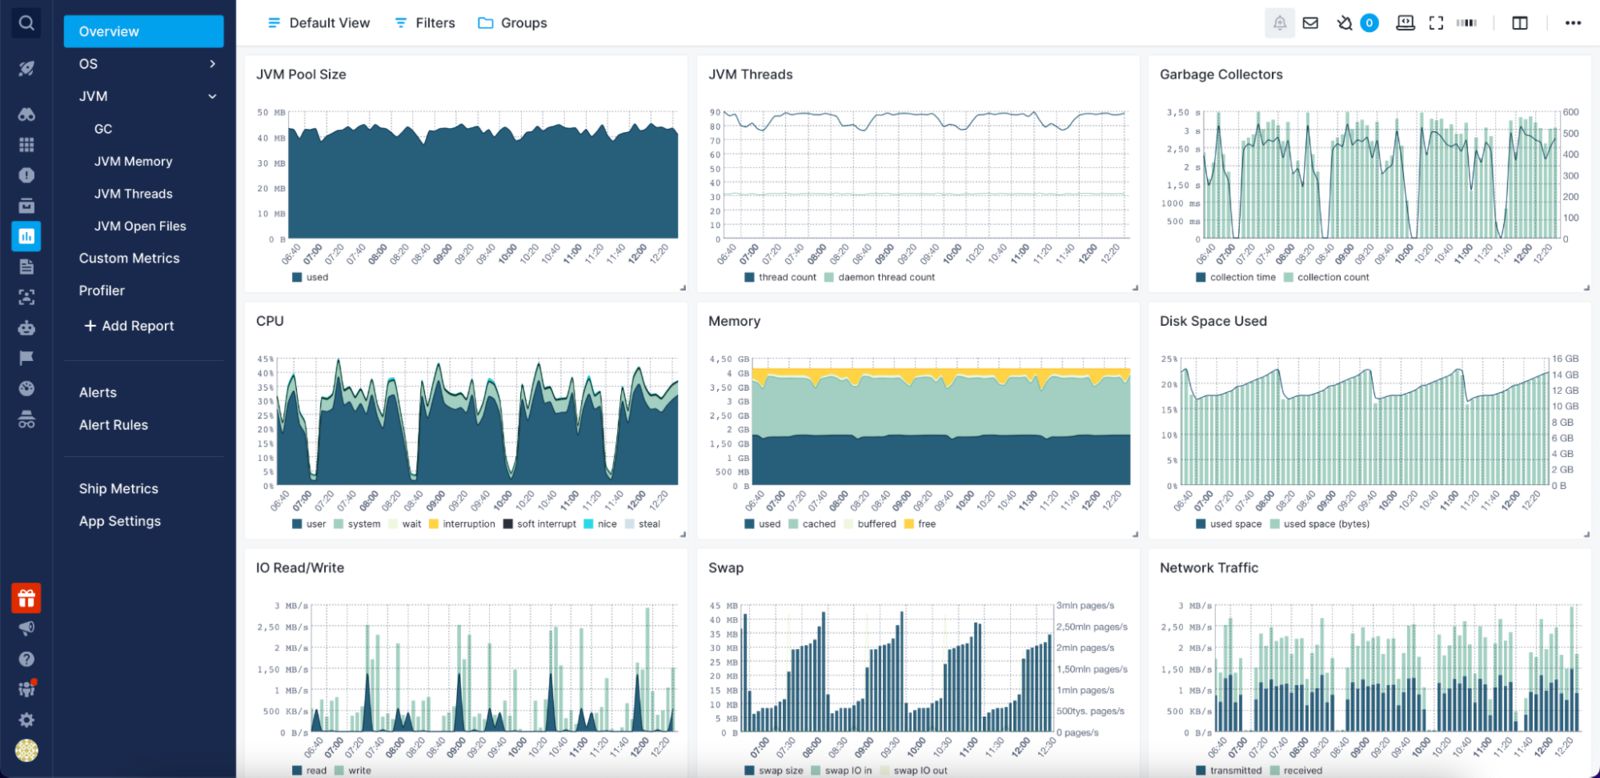
• CPU Usage: Keeping track of CPU usage will help you identify any potential CPU-intensive processes or threads that may be hindering system performance.
• Memory Utilization: Keeping track of memory utilization will help you understand if your system has enough resources allocated for its current workload or if it needs more RAM or additional servers added to handle more requests efficiently.
• Thread Pool Statistics: This metric will give insight into how many connections are being handled by each thread pool within the application server and whether there are any issues with connection handling or thread pool saturation.
• Response Time: Response time is one of the most critical metrics when it comes to ensuring good user experience and application performance. Tracking response time will help you identify any latency issues as well as pinpoint potential performance bottlenecks within the system.
• Disk I/O Performance: High disk I/O usage can lead to poor application performance due to slow read/write operations from disk storage devices. Monitoring disk I/O will help identify what kind of workloads may be causing these bottlenecks so that they can be addressed appropriately.
• Network Traffic Volume: The amount of traffic being exchanged between your application server and other services should be monitored in order to ensure optimal network utilization and reduce latency issues caused by high network traffic volumes.
• Error Logging: Tracking errors across different components in your system will enable you to quickly identify any potential problems with your applications before they become serious issues down the line.
By monitoring these key metrics on a regular basis, you can ensure optimal performance for all applications hosted on Tomcat while minimizing downtime due to unexpected errors or security threats. Implementing an effective monitoring strategy is essential for keeping your applications up-to-date and running at peak efficiency all the time!

Monitoring Apache Tomcat Server
Monitoring the Apache Tomcat server is an important part of system administration, as it helps to identify any potential issues before they become serious. There are several ways to monitor the Tomcat server, depending on your needs and configuration.
The first step is to configure logging. Tomcat supports a variety of log formats and levels, which allow you to get detailed information about requests and responses, connection times, errors, etc. By carefully configuring the log levels and format you can get the maximum amount of information from your server.
The next step is to set up monitoring software such as Munin or Nagios. This will allow you to track the performance of the server over time, including CPU usage, memory usage, response time, etc. This is useful for spotting potential problems early on and taking appropriate action before they become serious.
Finally, you should also consider using a web-based monitoring tool such as New Relic or AppDynamics. These tools provide detailed performance data about the Tomcat server in real time and can be used to identify any potential issues quickly.
By taking these steps you can ensure that your Apache Tomcat server is monitored effectively and any potential issues can be identified quickly and dealt with efficiently.
Monitoring Tomcat Logs
Monitoring Tomcat logs is a vital step to ensure that your web application is running optimally. Tomcat logs can be monitored in two ways: manually or through automated monitoring tools.
Manually monitoring the Tomcat Logs requires you to open the log file and look for any errors or warnings. The log file is located in the logs directory below the Tomcat root directory and has a date appended to its name (MM-DD-YYYY). You should review each day’s log file to detect any issues that may have occurred during the day.
The second option is to use automated monitoring tools, like Splunk or ELK stack, which can monitor your Tomcat logs in real-time and alert you if any irregularities are detected. These tools allow you to set up thresholds for specific events and will automatically send an alert when those thresholds are exceeded. This makes it easier to detect potential problems before they become serious issues.
No matter which method you choose, it’s important to regularly monitor your Tomcat logs so that any issues can be identified and addressed quickly. This will help ensure that your web application runs smoothly and optimally at all times.
Monitoring Server Activity
Monitoring server activity is an essential part of managing any server. It helps you understand how your server is performing, identify potential issues, and take corrective action before they become serious problems. To monitor server activity, you should:
1. Establish a baseline – A baseline is an ideal standard of your server performance. It helps you measure your system’s performance over time so that you can detect any sudden changes in server activity.
2. Track key metrics – Monitor key metrics such as CPU usage, memory usage, disk utilization, and network traffic to quickly identify any potential issues with your server’s performance.
3. Use effective monitoring tools – Choose the right monitoring tools for your environment to ensure that you are able to effectively monitor all aspects of your server’s activity. Popular monitoring solutions include Nagios and Zabbix.
4. Monitor consistently – Set up consistent monitoring cycles to ensure that your servers are monitored on a regular basis and any performance issues are identified quickly and addressed promptly.
5. Set up notifications and reports – Configure notifications and reports to keep track of changes in server performance over time and be alerted when certain thresholds are exceeded or if certain events occur on the server that require attention.
Checking Active Sessions in Tomcat
In order to check active sessions in Tomcat, you can use the Java Management Extension (JMX) to access the internal statistics of Tomcat. You can also use a JavaEE applications monitoring tool such as JavaMelody, which will help you monitor your application in both QA and production environments. Through these methods, you will be able to view the number of active sessions, as well as various other metrics related to the performance and health of your application.
Does Tomcat Have Access Logs?
Yes, Tomcat does have access logs. By default, Tomcat 7 enables access logging which records all requests processed by the server. This log is distinct from other logs stored in ${tomcat_home}/logs and contains information such as the client IP address, requested resource, response size, response status code, and processing time. The access log is located in ${tomcat_home}/conf/server.xml and can be configured to meet your specific needs.
Monitoring Tomcat Logs in Linux
Monitoring Tomcat logs in Linux can be done by using the tail command. The tail command allows you to view the last few lines of a file, making it useful for monitoring log files. To use the tail command to monitor a Tomcat log file, you can run the following command:
tail -f /var/log/tomcat/[logfile]
Where [logfile] is the name of the log file you want to monitor (e.g. catalina.out or localhost_access_log). This command will display the last few lines of the specified log file, and will continue to update as new entries are added to the log.
Another option is to use a logging tool such as Logstash or Splunk which can be used to aggregate and analyze logs from multiple sources. These tools provide a graphical interface for monitoring logs, allowing you to quickly identify any issues that may arise.
Conclusion
In conclusion, Tomcat monitoring is an essential part of managing a web server. It allows administrators to identify and address any issues that arise with the server, such as performance issues or deadlocks. Tomcat can be monitored in a variety of ways, such as using the Tomcat logs, netstat command, or other monitoring tools. Monitoring Tomcat will ensure that your web server is running smoothly and efficiently.


