As computer technology continues to advance, graphics processing units (GPUs) have become a crucial component for many users. Whether you’re an avid gamer, a video editor, or a software developer, having a reliable GPU can significantly improve your computer’s performance. However, like any other piece of hardware, GPUs can also experience issues that can negatively impact their functionality.
One of the most effective ways to identify potential problems with your GPU is by conducting a test. There are several methods you can use to test your GPU, and we’ll cover some of the most common ones in this article.
Firstly, you can check the device status of your GPU in the Device Manager. This is a simple way to determine whether your GPU is functioning properly or not. Open the Control Panel and click on “System and Security.” From there, select “Device Manager” and look for the “Display Adapters” section. Double-click on your GPU’s name and check the device status. If it says “This device is working properly,” then your GPU is likely functioning as it should.
However, if you find that the device status says something else, such as “This device is not working properly,” then you may need to troubleshoot the issue or seek professional help.
Another method is to run heart-monitoring software like GPU-Z. This tool can help you monitor your GPU’s temperature, clock speed, and other critical metrics. After installing GPU-Z, run a stress test using a utility like the Heaven Benchmark tool. As the program runs, monitor the heat and make sure that the GPU temperature doesn’t exceed 80°C. Additionally, look for any stutters, glitches, or random artifacts that may occur during the test. If you notice any of these issues, it could be a sign that your GPU is experiencing problems.
You can also use the GPU Usage tool, which is built into Visual Studio. This tool can help you monitor your GPU’s usage and identify any potential issues. To access the GPU Usage tool, go to the main menu and choose “Debug > Performance and Diagnostics” or press “Alt+F2” on your keyboard. In the Performance and Diagnostics hub, check the box next to “GPU Usage.” Then, select “Start” to run your app under the tools you selected. This will allow you to monitor your GPU’s usage and identify any potential issues that may be causing problems.
Testing your GPU is an essential step in maintaining your computer’s performance. Whether you’re a gamer, a video editor, or a software developer, having a reliable GPU is critical to your work. By using the methods outlined in this article, you can identify any potential issues with your GPU and take the necessary steps to resolve them. So, take some time to test your GPU today and ensure that it’s functioning as it should be.
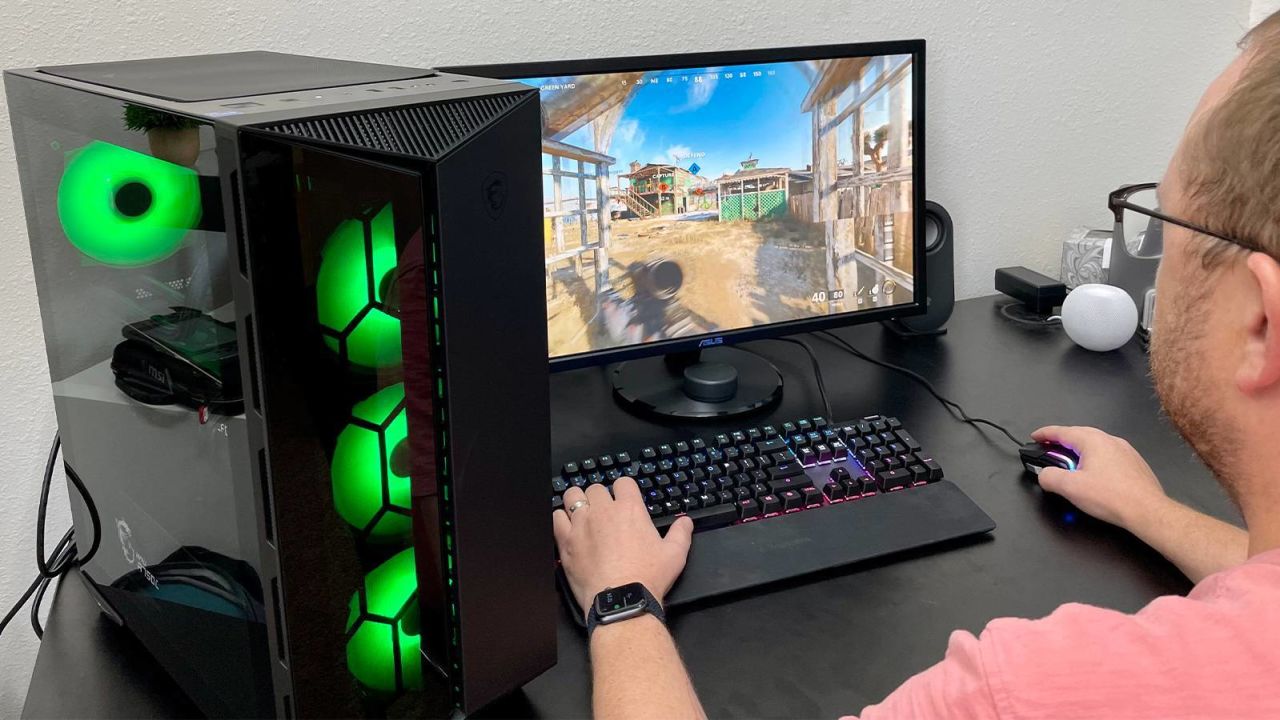
Checking If GPU Is Working Properly
To check if your GPU is working properly, you can follow these steps:
1. Open Windows’ Control Panel.
2. Click on “System and Security” and then click on “Device Manager.”
3. Locate the “Display Adapters” section and double-click on the name of your graphics card.
4. Look for the information under “Device status.” It should typically say, “This device is working properly.”
5. If it does not say this, there may be an issue with your GPU. You can try updating the drivers for your graphics card, or you may need to replace the card altogether.
Additionally, you can also check the temperature of your GPU using software such as MSI Afterburner or GPU-Z. If the temperature is too high, it could indicate an issue with your GPU’s cooling system. You can also run a benchmark test on your GPU using software like 3DMark to determine if it is performing to its expected level.
Checking for Faulty GPU
To check if your GPU is faulty, you can follow these steps:
1. Download heart-monitoring software like GPU-Z.
2. Install and run the software.
3. Observe the temperature readings of your GPU while it’s idle. The idle temperature should be around 30-40°C.
4. Run a stress test using a utility like the Heaven Benchmark tool.
5. Monitor the temperature readings of your GPU while the program runs. The GPU temperature shouldn’t exceed 80°C.
6. Observe the performance of your GPU while the program runs. No stutters, glitches, or random artifacts should happen. If you notice any of these issues, it may be an indication of a faulty GPU.
By monitoring the temperature and performance of your GPU during a stress test, you can determine if your GPU is faulty or not.
Running a GPU Diagnostic
To run a GPU diagnostic, you can use the GPU Usage tool available in Visual Studio. Here are the steps you can follow:
1. Open your project in Visual Studio and go to the main menu.
2. Choose Debug > Performance and Diagnostics (or press Alt+F2 on the keyboard).
3. In the Performance and Diagnostics hub, you will see various options. Check the box next to GPU Usage.
4. You can also select other tools you want to use for diagnostics, such as CPU Usage or Memory Usage.
5. At the bottom of the Performance and Diagnostics hub, click on the Start button to run your app under the selected tools.
6. Now, you can monitor the GPU usage of your app and check for any performance issues or bottlenecks.
By following the above steps, you can easily run a GPU diagnostic using the GPU Usage tool in Visual Studio.
Conclusion
Testing your GPU is an essential step in ensuring that your system is functioning properly and performing at its best. By using tools such as GPU-Z and Heaven Benchmark, you can monitor the temperature of your graphics card and check for any stutters, glitches, or artifacts. Additionally, using the GPU Usage tool can provide valuable insights into how your GPU is performing in real time. Remember to always keep an eye on the device status in the Device Manager to make sure that your graphics card is working properly. By regularly testing your GPU, you can identify any issues early on and take steps to resolve them, ensuring that your system runs smoothly and efficiently.

