Are you looking for the ultimate tcpdump cheat sheet? tcpdump is a powerful packet analyzer that allows you to intercept and display packets that are created or received by a computer. It’s incredibly useful when it comes to troubleshooting networks, as it can capture and analyze data flowing through a particular interface. If you’re new to tcpdump, here is an overview of the most commonly used commands and flags.
One of the most basic commands for tcpdump is the -i flag, which allows you to specify a network interface to capture packets. For example, if your computer has two network interfaces (e.g., eth0 and eth1), you can use this flag to capture packets from only one of them.
Another useful option is the -c flag, which allows you to limit the number of packets that will be captured and displayed. By default, tcpdump will resolve IP addresses to hostnames and use service names instead of port numbers. However, if you want more detailed information about each packet, you can use the -X option to print out the packet data in hexadecimal format.
You can also save packet data into a file for further analysis by using the -w option with tcpdump command. If you want to read back the output from a previously saved file, all you have to do is use the -r option with tcpdump command and specify its path.
Finally, if you want even more control over what kind of packets will be displayed onscreen, you can use boolean expressions together with your command line arguments. This allows you to filter out only those packets which match certain criteria like source or destination address or port number etc.
We hope this brief overview of some of the most commonly used commands in tcpdump has been helpful! We highly recommend taking some time to read through its man page so that you can get better acquainted with all its features and capabilities!

Using TCPdump for Network Analysis
Tcpdump is a powerful packet-analysis tool that can be used to monitor, analyze, and debug network traffic. It runs in the command line and works by intercepting and displaying packets sent to or from a computer. By using tcpdump, you can capture and analyze data packets traveling over a network and identify any malicious activity or network issues.
To use tcpdump, you must specify the interface on which you want to capture data packets, as well as the filter expression that defines which packets to capture. Once you’ve set up the parameters for capturing data, you can use several flags to control how tcpdump operates. For example, you can use the -A flag to print out each packet in ASCII format or the -X flag to show each packet in hexadecimal format.
Tcpdump is a powerful tool for diagnosing network issues and can be used for troubleshooting anything from basic connectivity problems to complex security breaches. With its wide range of options and features, tcpdump is an invaluable resource for network administrators and engineers alike.
Capturing Five Packets Using Tcpdump
To capture only 5 packets using tcpdump, you can use the -c flag with a number of your choice. For example, to capture only 5 packets, use the command: “tcpdump -c 5”. This will capture only the first 5 packets that pass through your system. Additionally, you can add other flags such as -i to specify an interface name for which to capture packets on, or -w to write the captured packets to a file.
Uses of the Tcpdump Command
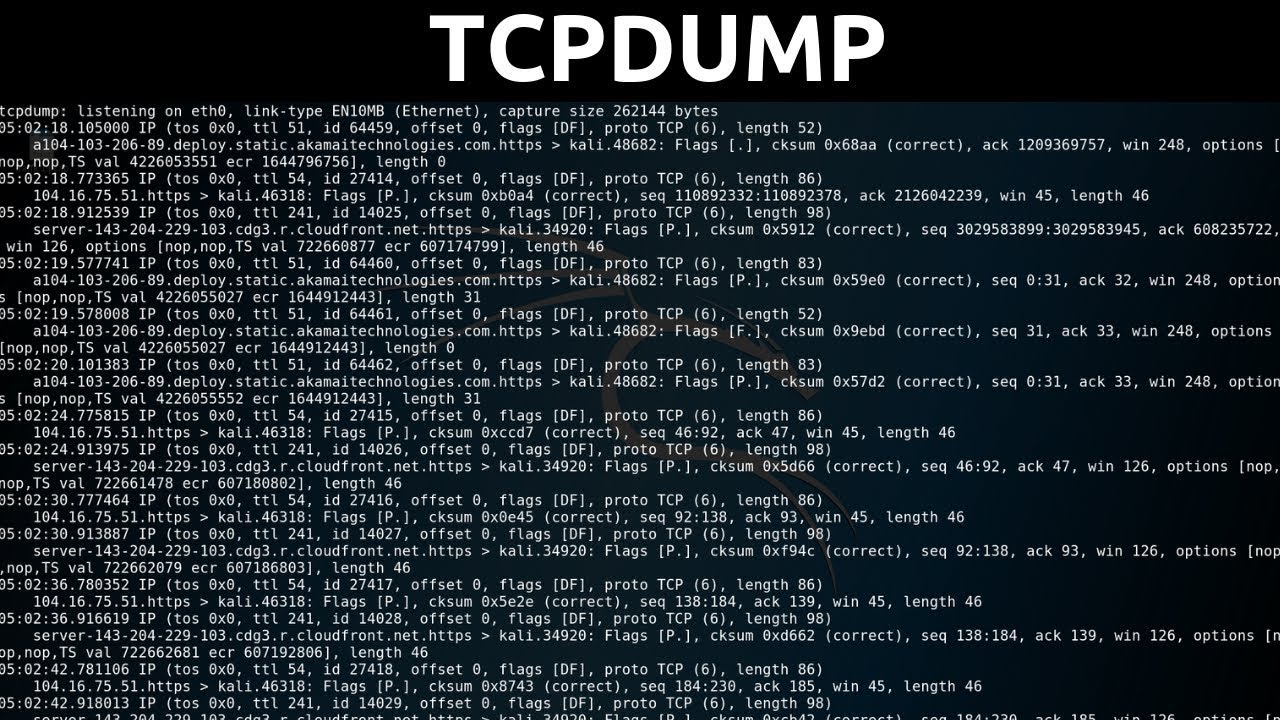
The tcpdump command is a powerful network monitoring and packet analysis tool. It can be used to capture, filter, and inspect network traffic going in and out of a system. It can be used to troubleshoot network issues, identify suspicious activities, analyze protocols, or just monitor network activity. The output from tcpdump can provide valuable information about IP addresses, ports, packet sizes, and other packet header fields. With the -w flag, the captured data can be saved for further analysis with other tools.
Decoding TCPdump Output
Decoding tcpdump output can be done by using a protocol analyzer tool such as Wireshark. Wireshark is an open-source, cross-platform protocol analyzer that allows users to capture, view and analyze network traffic. It can be used to quickly decode tcpdump output into its various protocol layers such as Ethernet, IP, TCP, UDP, and more. Additionally, it supports deep packet inspection which allows users to examine the contents of individual packets in detail. Once Wireshark is installed, you can open your tcpdump file by going to File > Open and selecting the desired file.
Setting Up a TCP Dump
To set up a TCP dump, you will first need to install the tcpdump tool. You can do this by downloading the tcpdump rpm package, then logging into DSVA via SSH as a DSVA user (default password is ‘dsva’). Once logged in, switch to the root user by entering ‘sudo -s’. Upload the package to DSVA under path:/home/dsva and unpack the tar package. Finally, install the rpm packages.
Once installed, you can use tcpdump to capture live network traffic and analyze it for various purposes such as monitoring network performance or troubleshooting network issues. To start capturing data with tcpdump, open a terminal window and enter ‘tcpdump –i [interface] –w [filename]’ where [interface] is the name of the interface you want to capture on (e.g. eth0) and [filename] is the name of the file where you want to store your captured data (e.g. logfile.pcap). This command will begin capturing traffic on that interface until you press CTRL+C to stop it. You can then view your captured data using a packet analyzer such as Wireshark or TCPDump itself if desired.
Starting a TCP Dump
Starting a TCP dump is a great way to capture and analyze network traffic. To get started, first you need to make sure that the tcpdump package is installed on your system. On most Linux systems, you can use your package manager to install tcpdump. Once installed, you can begin capturing packets by running the following command:
sudo tcpdump -i [interface] -w [filename].pcap
Where [interface] is the interface you want to capture from and [filename] is the name of the output file. This command will start capturing all the packets goig through this interface and store them in a PCAP format file that can be read by other network analysis tools. You can also pass additional parameters to refine what is being captured such as an IP address or port number. To view a list of available options, run “tcpdump –help”.
Once you have started capturing packets, you can stop it at any time with Ctrl+C. You can then open up the output file using Wireshark or another packet analyzer and begin examining the data that was captured.
Conclusion
In conclusion, a tcpdump cheatsheet is a useful tool for anyone looking to analyze and monitor their network traffic. With its various command options, users can capture packets flowing through a specific interface or save packet data in a file for further analysis. It also allows users to read the output of a file by using the -r option. With tcpdump, users have an effective way to troubleshoot network issues and gain valuable insights into their network traffic.


