Safari Inspect Element is an incredibly useful tool for web developers and designers. It is a built-in feature of the Safari web browser that allows you to view and edit HTML and CSS code within the page. This can be extremely helpful when trying to debug or troubleshoot a website, as it allows you to quickly make changes without having to reload the page or switch to another application.
The Safari Inspect Element feature can be accessed by right-clicking on any element within the page and selecting “Inspect Element”. This will open up an interface window which displays the HTML code of the element alog with its associated CSS styles. From here, you can make changes directly to the code which will be reflected immediately in the page itself (although it is recommended that you save your work before leaving the page).
In addition to editing existing code, Safari Inspect Element also provdes some helpful features for inspecting elements such as displaying all CSS styles applied to an element, viewing all JavaScript events attached to an element, highlighting specific elements for easier selection, and more. You can even use this tool to quickly identify potential problems with your website’s structure or layout.
Overall, Safari Inspect Element is a powerful yet easy-to-use tool that can save web developers and designers a lot of time when creating or debugging websites. With its ability to quickly make changes without reloading pages and its various features for inspecting elements, this feature should definitey be part of any web developer’s workflow!
Inspecting Element in Safari iOS
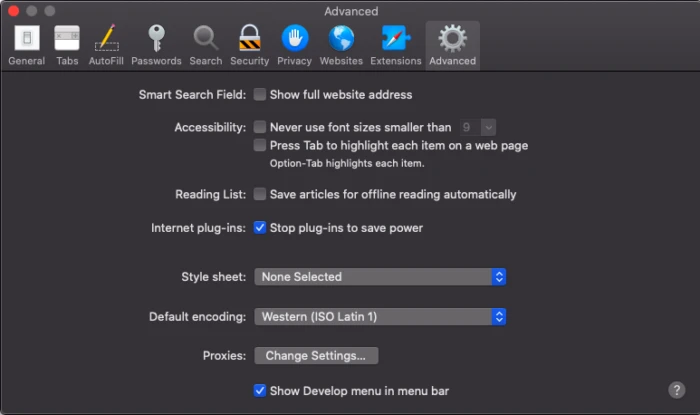
In order to inspect element in Safari iOS, you need to first ensure that the Develop menu has been enabled. To do this, open Safari browser and click on Safari > Preferences > Advanced. Tick the checkbox Show Develop menu in the menu bar.
Once the Develop menu is visible, open the page you wish to inspect and select Develop > (your device name) from the top menu bar. This will show a list of webpages currently open on your device. Select the webpage you wish to inspect and then use your finger to tap and hold on an element until a black box appears aound it. At this point, release your finger and a menu should appear with options to Edit, Copy or Delete the element. You can also use this menu to inspect various properties of the element such as its CSS styling or HTML code.
Editing Inspect Element in Safari
Editing Inspect Element in Safari can be done by first opening the Developer Tools window. This can be done in the Develop menu, or by using the keyboard shortcut Command + Option + I. Once the window is open, you will be able to view and edit HTML, CSS, and JavaScript code associated with a webpage. To edit an element of a page, right-click on it and select “Inspect Element” from the contextual menu that appears. This will open up a panel within Developer Tools whih will allow you to edit HTML elements within the page. You can also add or remove CSS styles or even add JavaScript code if desired. When you are finished making changes, click “Save” to commit them to the page.
Using Web Inspector in Safari
Using Web Inspector in Safari is a great way to analyze and debug web content. To get started, first make sure the Web Inspector feature is enabled. To do this, open Safari’s Preferences window and select the Advanced tab. At the bottom of the pane, check the box labeled ‘Show Develop menu in menu bar.’
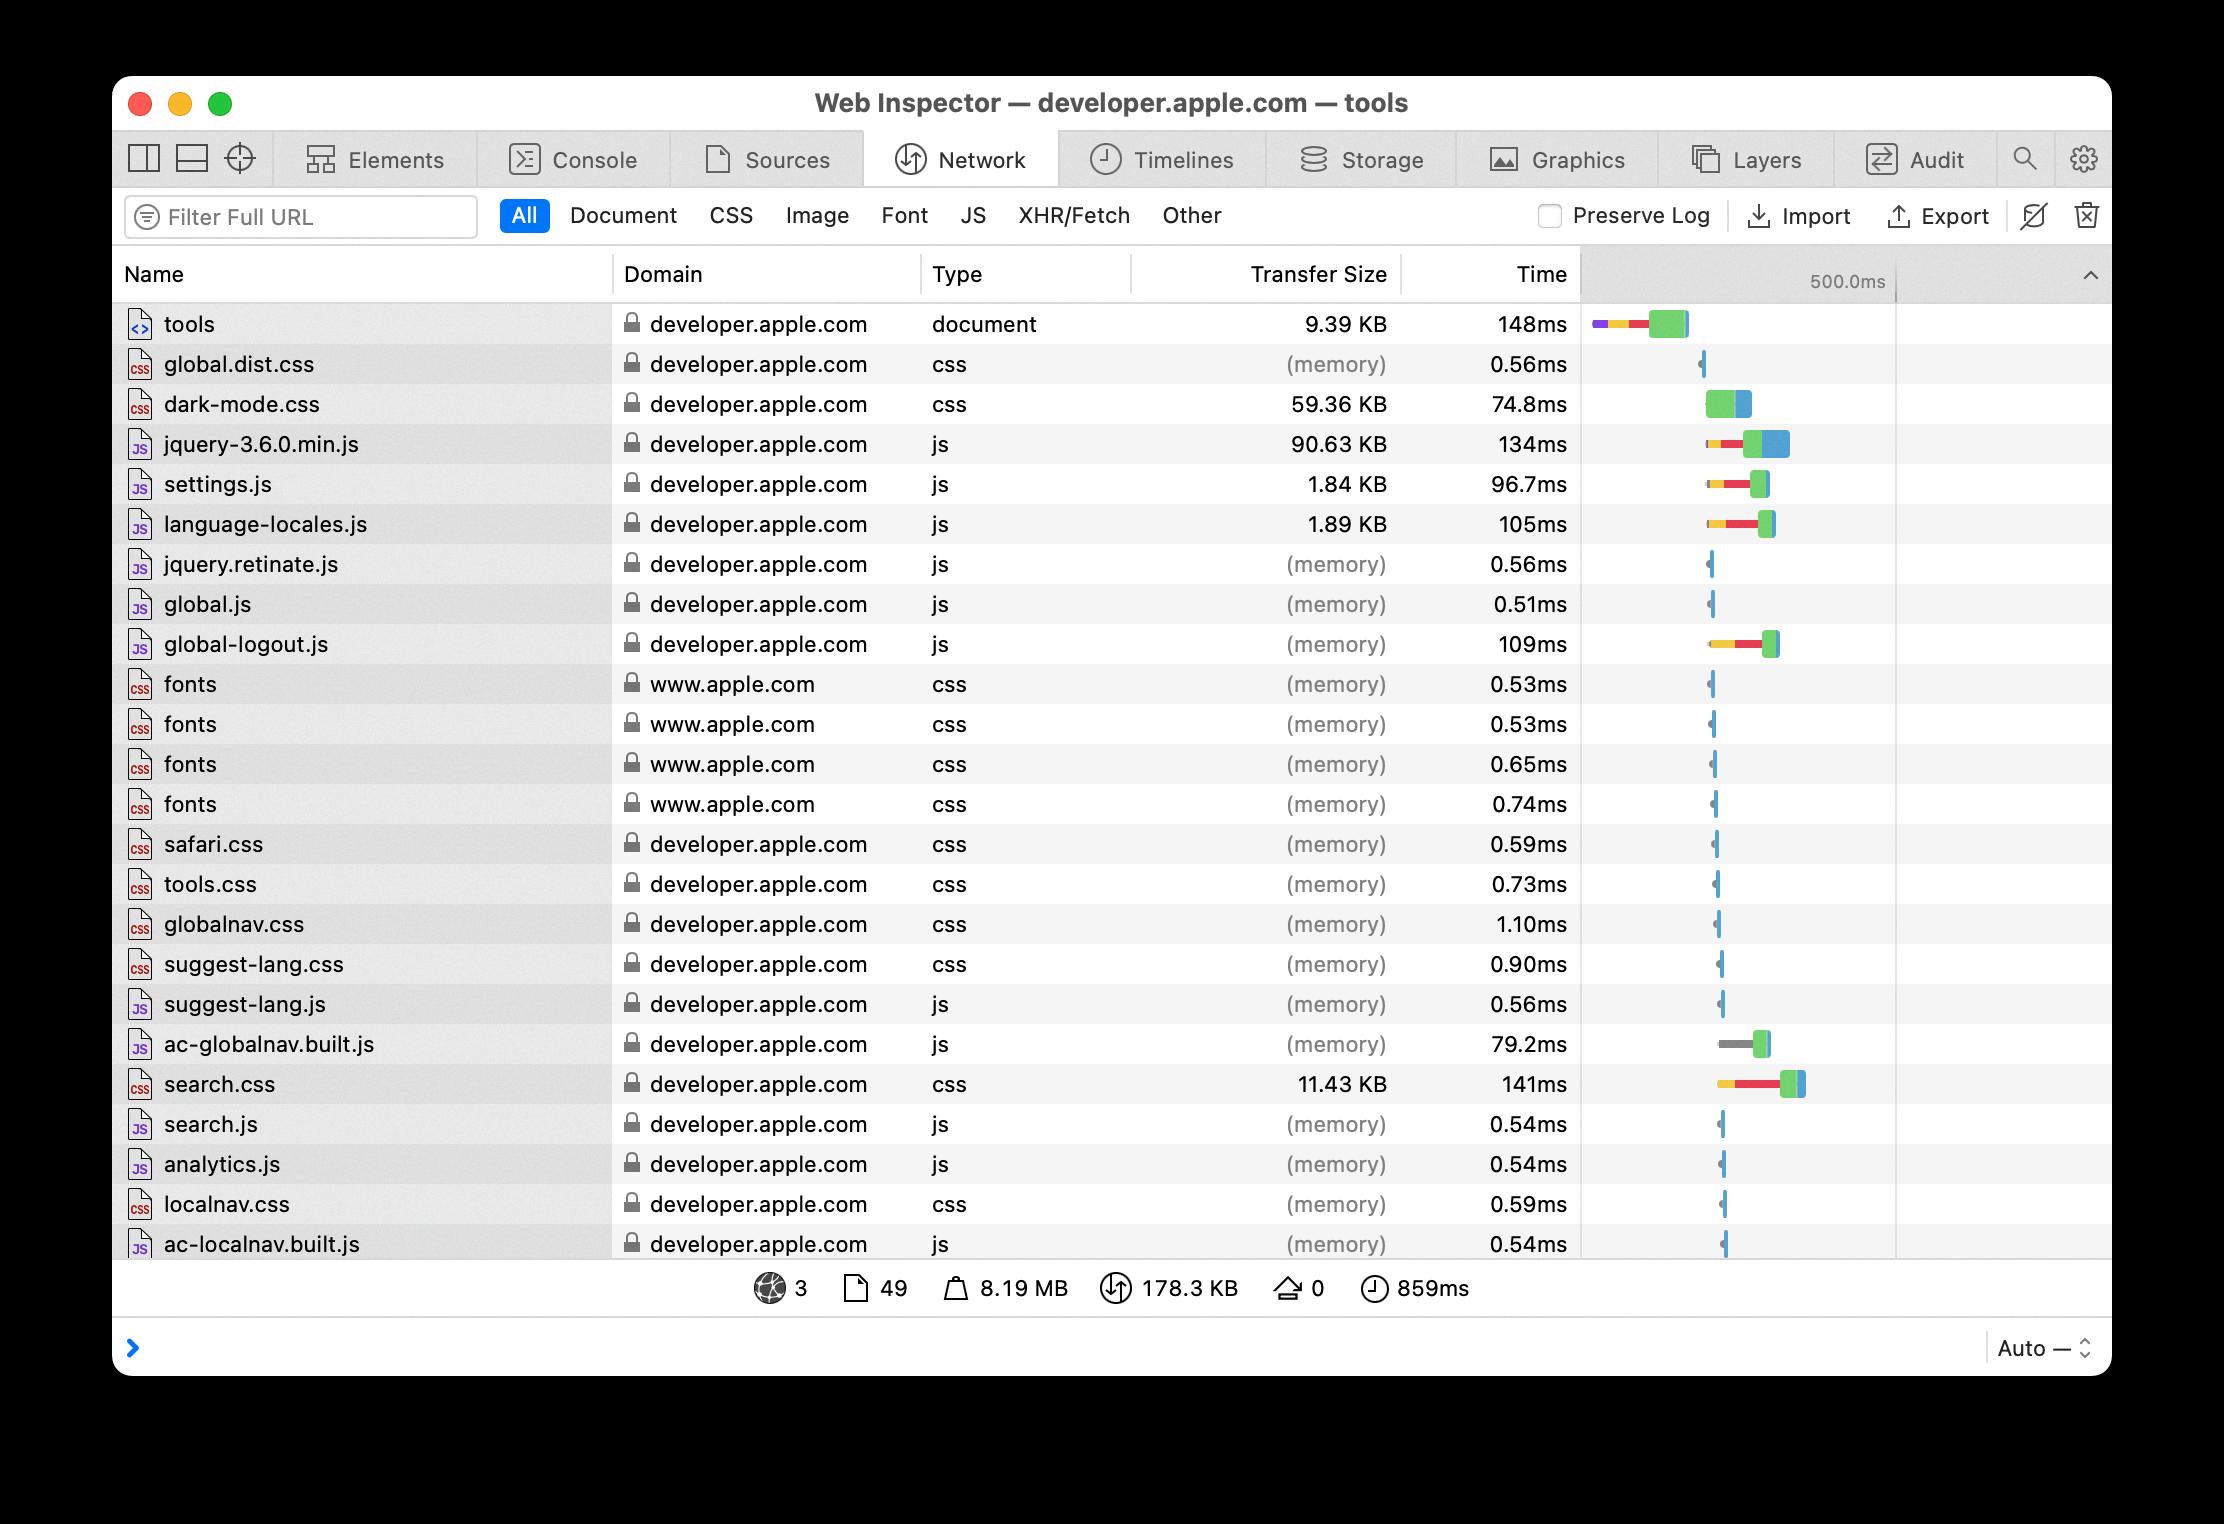
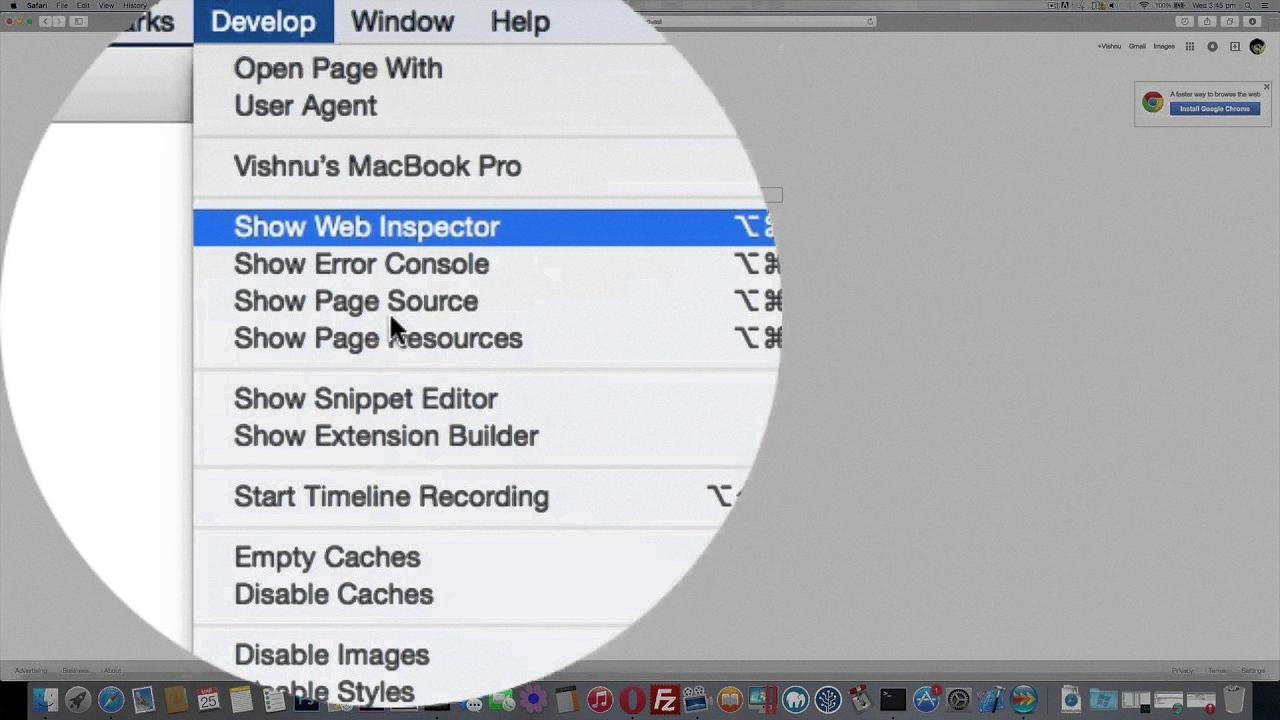
Once enabled, open any website in Safari and select Develop from the menu bar. Select Show Web Inspector from the dropdown menu that appears. This will open the Web Inspector window with a list of tabs for examining various aspects of your page’s content and performance.
Using these tabs, you can view HTML elements, CSS styles, JavaScript objects and code coverage information. You can also use the Elements tab to edit HTML elements on a page directly in your browser – very useful for quickly testing changes without hving to modify your source code.
With all of these tools availabe at your fingertips, you can easily identify errors or potential performance improvements that need to be made on your website. So next time you’re looking to troubleshoot or optimize a web page, give Web Inspector a try!
Using Developer Tools in Safari iOS
Using developer tools in Safari iOS is a great way to debug and inspect webpages on your device. To use developer tools, open the Safari browser, tap on the “Aa” icon located at the top rght of the window, then select “Developer Settings”. Here you will be able to select options such as “Show Web Inspector” and “Show JavaScript Console”. To view webpages with developer tools enabled, tap on the “Share” icon (square with an arrow pointing up) located at the bottom of the window and select “Request Desktop Website”. Once enabled, you can interact with elements on a webpage and access other features like debugging HTML/CSS issues or previewing media queries. An important note is that when you close Safari, any changes made in developer tools won’t be saved.
Editing a Website in Safari
In order to edit a website in Safari, you must first open the webpage in the browser. Once the webpage has loaded, right-click anywhere on the page and select “Inspect Element” from the dropdown menu. This will open a window with HTML code and other elements associated with that page. You can then edit any of these elements by double-clicking on them and making changes. Once you are finished making changes, hit return to apply them to the webpage. Keep in mind that any changes you make will not be permanent, so if you want to save your edits, you may need to save or export the page from witin Safari.
Source: developer.apple.com
Inspecting Element on Mac
Yes, you can inspect elements on a Mac. To do so, first select the ‘Show Develop menu in menu bar’ option in your browser’s settings. After that, when you are browsing a website, right click on the item you wish to inspect. Finally, select the ‘Inspect Element’ option. This will open up the inspector window which allows you to view the code behind the website you have inspected.
Enabling Debugging in Safari
To enable debugging in Safari, you’ll need to open the Develop menu. To do this, click on the Safari menu at the top of your screen and select Preferences. Next, go to the Advanced tab and check the box next to Show Develop menu in menu bar. Once you’ve done this, a new Develop menu will appear in the Safari menu bar. You can then select a connected device or simulator from this menu to start debugging your webpages.
Opening the Developer Console in Safari
To open the developer console in Safari, you will need to first turn on the Develop menu. To do this:
1. Open the Safari menu in the Mac menu bar.
2. Select Preferences from the drop-down list.
3. Navigate to the Advanced tab in the Preferences dialog.
4. Check the “Show Develop menu in the menu bar” box.
Once you have enabled the Developer menu, you can open it by clicking Develop in your Mac menu bar, then selecting Show Web Inspector from the drop-down list. This will open up a panel on your browser window that contains your console information and any other development tools availabe for use on Safari.
Inspecting a Website
Inspecting a website is a great way to get an understanding of how it is built and what technologies are being used. To inspect a website in Chrome, first open the website you want to inspect and then right-click on any element on the page. From the menu that appears, choose ‘Inspect’ to open the Developer Tools window. This window will provide you with detailed infomation about the HTML code, CSS styles, and JavaScript functions that make up the page. You can use these tools to analyze the structure of elements on the page, view or edit CSS styles, and debug JavaScript functions. Additionally, you can also use tools inside Developer Tools such as Network and Performance to view how much time it takes for resources to be loaded from the server or how much data is being transferred over the network.
Editing Inspect Element on Mac
To edit Inspect Element on Mac, first right-click anywhere on the page and select ‘Inspect Element’ from the dropdown menu. Alternatively, you can press Command+Option+i on your keyboard to open the Inspector directly. Once the Inspector is open, you can make chanes to any element on the page by clicking on it in the HTML tree. To save your changes, simply click the ‘Save’ button in the bottom right corner of the window. Please note that any changes made with Inspect Element will not be saved permanently and will be reverted back to their original state when you refresh or leave the page.
Inspecting Element in Safari on Mac
Inspecting elements in Safari on a Mac is a simple process. First, right-click any part of the page and select “Inspect Element”. This will open the Inspector view with that element selected. You can also open the Inspector view from the top menu bar by selecting Develop > Show Web Inspector, or you can use the shortcut command-option-I. Once opened, you can use the Inspector to explore and edit page elements.
Opening Inspect Element
Inspect Element, also known as Developer Tools, is a tool used to view and edit the HTML and CSS of a webpage. To open Inspect Element on a PC or Mac, right-click on the page and select Inspect (or Inspect Element). On Android devices running Chrome, you can open Inspect Element by pressing F12 or by goig to the “More” menu in the top-right corner of your browser window, selecting “Settings” and then tapping on “Developer tools.”
Source: youtube.com
Shortcut for Opening Inspect Element on Mac
The shortcut to open the Chrome Inspector (also known as Inspect Element) on Mac is Option + ? + I. This feature allows you to emulate the environment of varous devices right on your own Mac, allowing you to check how your website looks on mobile. Additionally, this feature also enables you to view and edit the code behind any website, allowing for a deeper understanding of how the webpages are built.
Conclusion
Safari Inspect Element is an invaluable tool for web developers and designers. It allows users to view and edit HTML and CSS code in order to make canges to the design of their websites. It is easy to use, powerful, and a great way to troubleshoot web pages. With Safari Inspect Element, users can quickly identify errors, experiment with different design elements, and ensure their website looks just the way they want it. Overall, Safari Inspect Element is an essential part of any web developer’s toolkit.

