Redis monitoring is an essential part of maintaining a healthy and secure Redis environment. By monitoring the performance of your Redis instance, you can spot any potential problems before they become serious issues.
Monitoring Redis is a complex task, as there are many different metrics that need to be tracked. The most important metrics to monitor include memory utilization, CPU usage, connection metrics, operations, keyspace metrics, expired/evicted keys, latency, and persistence. Additionally, understanding how these metrics interact with each other can help you optimize your Redis environment for peak performance.
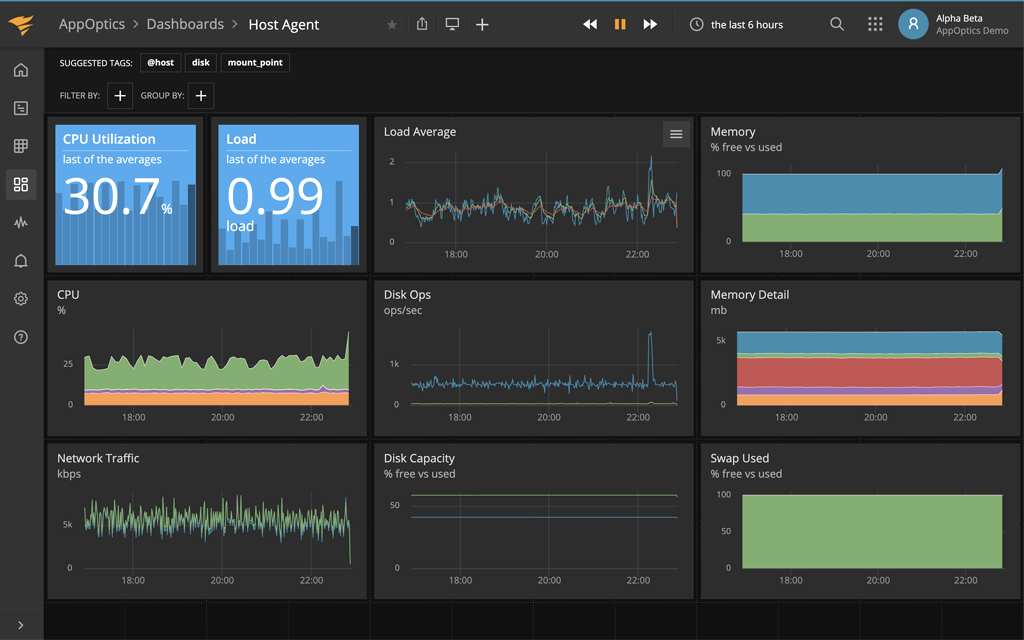
To monitor your Redis environment effectively, you should use a graphical management frontend such as Redsmin or Redis Commander. These tools provide comprehensive monitoring capabilities and allow you to view key metrics at a glance and in real-time. Additionally, many of these tools also offer additional features such as the ability to perform CRUD operations on data or delete keys in bulk.
Another way to monitor your Redis environment is by running the info command in a Redis shell (which you can open by running redis-cli in your terminal). This command will show you detailed information about the current state of your server such as memory usage, CPU usage, and connection metrics. Finally, the RedisInsight graphic user interface provides an easy-to-use interface that allows you to browse and visually interact with data stored within your Redis instance.
Overall, monitoring your Redis environment is an essential part of maintaining peak performance from your server. By using graphical frontends such as Redsmin or Redis Commander along with running the info command from the terminal, you can ensure that no problems go unnoticed and that your server runs smoothly for years to come!

Monitoring Redis
When monitoring Redis, there are several key metrics to keep an eye on in order to ensure the system is performing optimally. Memory utilization is one of the main metrics to watch, as it can quickly rise if not managed properly. CPU usage should also be monitored, as each request processed by Redis requires CPU cycles in order for it to be completed. Additionally, connection metrics such as the number of connections and total data transferred should be tracked. Operations such as read and write operations should also be monitored as they can indicate how quickly data is being processed. Keyspace metrics such as the number of active keys expired/evicted keys, and latency can reveal performance issues. Finally, persistence metrics like RDB file size or AOF file size should be tracked in order to ensure that your data is properly persisted between restarts. By monitoring these key metrics regularly, you can ensure that your Redis system is running smoothly and efficiently.
Monitoring Redis Memory Usage
Monitoring your Redis memory usage is an important part of managing your Redis cluster. The most common way to monitor memory usage is to use the ‘info’ command, which will display a variety of information about the current state of your cluster. Specifically, the ‘used_memory’ entry will show the total amount of memory allocated to the Redis cluster, while the ‘used_memory_rss’ entry will show the total number of bytes expressed by the operating system. Additionally, you can use the ‘used_memory_human’ entry to view the used_memory value in a human-readable format. If you’re looking for more detailed information about individual keys and their associated values, you can use the ‘debug object’ or ‘object encoding’ commands. By using these commands, you can get a better understanding of how much memory is being used by each key and its associated value. Finally, if you need to monitor usage over time, you can use Redis’s built-in monitoring tools such as MONITOR and SLOWLOG. These tools provide useful insights into how your cluster is using its memory resources over time.
Exploring the Possibility of a UI for Redis
Yes, RedisInsight is a graphical user interface (GUI) for Redis that helps you browse and interact with your Redis data. With RedisInsight, you can easily browse, filter, and visualize your Redis keys, perform CRUD operations, or delete keys in bulk. It also offers helpful features such as displaying data in multiple formats (JSON, hexadecimal, MessagePack), as well as friendly keyboard navigation.
Understanding the Limits of Redis Data Storage
Redis is a very powerful and versatile database, but it’s important to remember that it has limits. Generally speaking, data that exceeds the available memory in your system could be considered “too much” for Redis. The exact amount of data that can be stored in Redis depends on the data structure being used. For example, hashes and lists can hold up to 2^32 elements each, while sets and sorted sets can hold up to 2^64 elements each. In practice, Redis has been tested to handle at least 250 million keys per instance.
It’s also important to consider the performance implications of storing too much data in Redis. As more data is stored in a single instance, operations on that data become slower as more resources are required to access it. Therefore, if you need to store large amounts of data, it may be beneficial to divide your data across multiple Redis instances or use other databases such as MySQL or Cassandra for storage.
Checking Redis Cache Performance
You can check your Redis cache performance by using the INFO command. This command will provide you with information about the number of keyspace_hits and keyspace_misses. The key to determining the performance of your cache is to look at the hit ratio, which is calculated by dividing the number of hits by the total number of requests (hits + misses). A good hit ratio to aim for is above 0.8, as this indicates that most requests are being serviced without having to fetch data from disk or other sources. If your ratio is below 0.8, then it could mean that a significant amount of keys have expired or been evicted due to insufficient memory allocation in Redis.
The Suitability of Redis for Long-Term Storage
Redis is a great option for long-term storage, as it provides better performance than traditional databases such as MySQL, MongoDB, and Elasticsearch. Unlike other databases, Redis can be configured to store data permanently rather than discarding it when memory runs low. This makes it ideal for applications with frequent data changes or ones that require data to be replicated when an environment is branched. Additionally, Redis is highly efficient and scales easily, making it suitable for applications with large datasets. Finally, Redis has built-in support for caching so you can take advantage of faster read/write operations without impacting long-term storage.
Conclusion
In conclusion, monitoring Redis is an essential part of ensuring optimal performance and reliability. Monitoring helps identify potential issues before they become major problems. It also helps you better understand how your application is using Redis, allowing you to make informed decisions about scaling and resource allocation. There are several tools available to help monitor Redis, including the INFO command in the terminal, graphical management frontends such as Redsmin or Redis Commander, and the RedisInsight GUI. With these tools, you can track key metrics such as memory usage, CPU usage, connection metrics, latency, and more. Armed with this data and insight into your system’s behavior, you can ensure that your application is running smoothly and efficiently.


