Monitoring the performance of your web server is essential for ensuring that it runs smoothly and efficiently. NGINX, one of the most popular web servers available today, offers powerful monitoring capabilities through its ngx_http_stub_status_module module. With this module, you can easily monitor your server health in real-time and make sure that your website is always up and running. In this blog post, we’ll take a look at the steps you need to take to enable the NGINX status page in order to monitor your server performance.
First off, you have to check if the NGINX status page is enabled or not. To do this, open up the nginx.conf file by typing “sudo nano /etc/nginx/nginx.conf” in a terminal window. Then add the following line:
# Enable stub_status page
server {
listen 80;
location /nginx_status {
stub_status on;
}
}
Once you’ve added this line, save and close the file. Then restart your NGINX server with this command: “sudo service nginx restart”. After that, you can test if the status page is working by running “curl http://localhost/nginx_status” in a terminal window. If everything went well, it will show an output that contains information about your server performance such as requests per second and uptime.
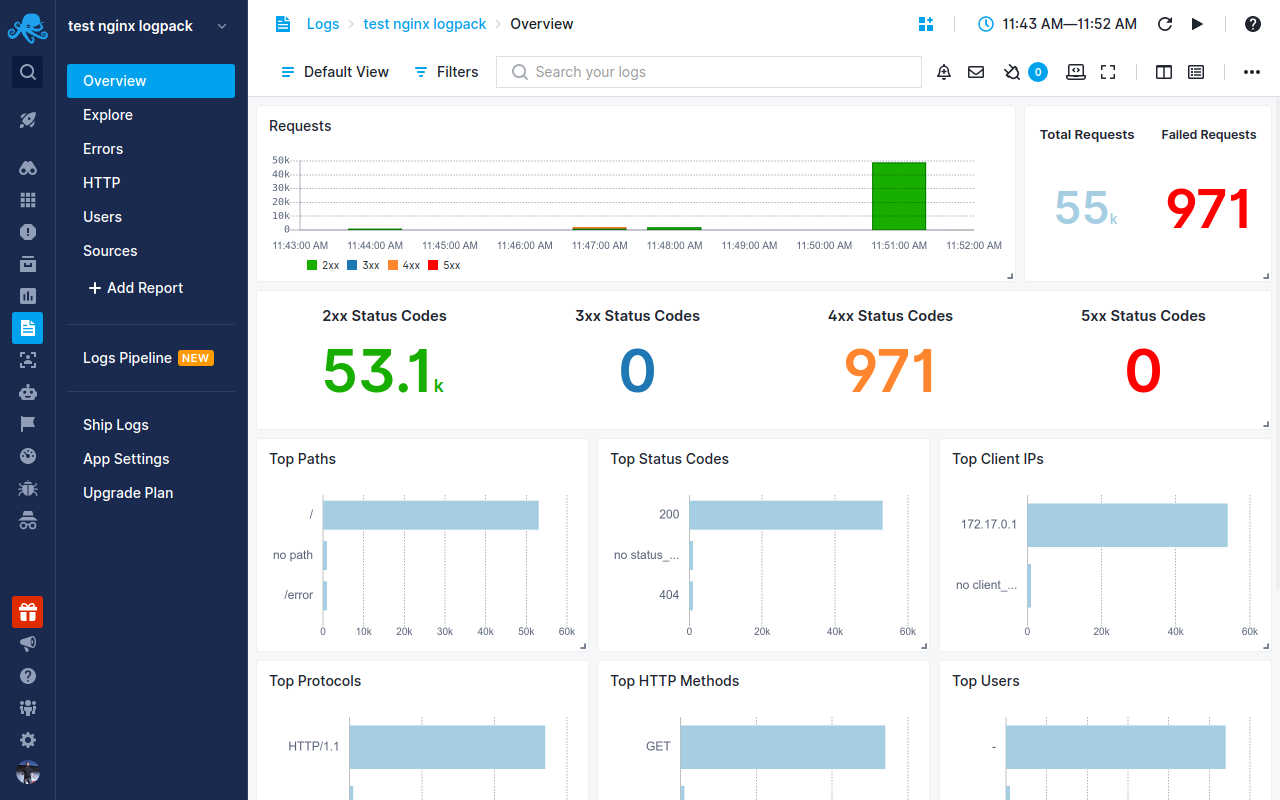
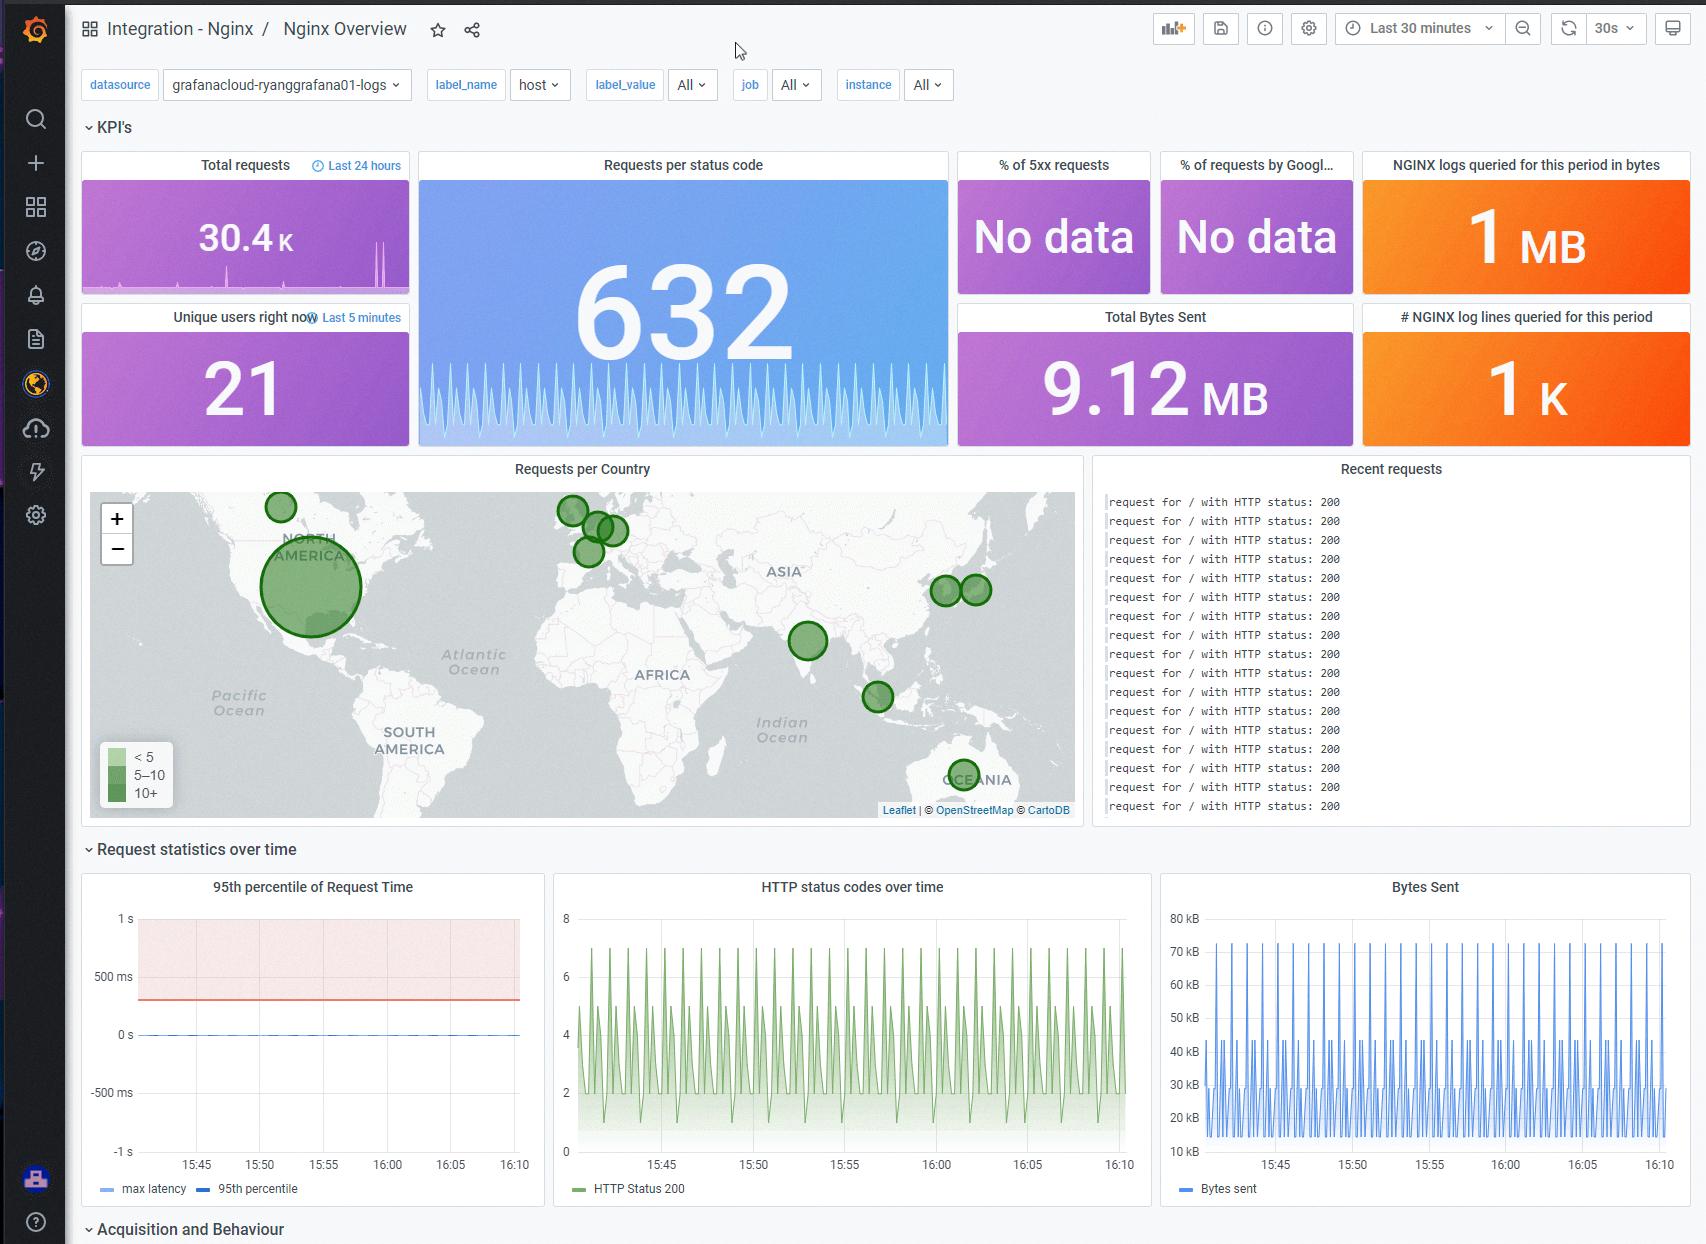
In addition to enabling the NGINX status page, there are other tools available that can help you monitor your web server performance more effectively. Sematext Monitoring is an infrastructure monitoring tool that supports real-time NGINX performance monitoring. Prometheus and Grafana are open-source tools that provide powerful metrics visualizations for web servers such as NGINX Plus. New Relic provides automated alerting capabilities and detailed reporting for web applications hosted on any platform including NGINX Plus instances. Lastly, SolarWinds Server & Application Monitor provides deep insights into application and system performance metrics with an easy-to-use dashboard interface specifically designed for IT professionals managing web servers powered by NGINX Plus or any other software stack component like MySQL or Apache Web Server.
All these tools provide great insights into how well your web server is performing so that you can take proactive measures to ensure optimal performance at all times. That being said, it’s important to note that although these tools are invaluable when it comes to monitoring your system, they come at a cost. However, since NGINX is free, it’s worth considering as an option for monitoring your web server.

Monitoring NGINX
Monitoring NGINX is an important part of ensuring your web servers are running smoothly and efficiently. There are several tools available to help you do this, each offering a different set of features that can be tailored to meet your specific needs.
The most popular tool for monitoring NGINX is Sematext Monitoring. It provides real-time performance monitoring and detailed analytics, as well as the ability to set up alerts when pre-defined thresholds are crossed. Prometheus and Grafana are also popular tools, offering visualization capabilities that allow you to quickly identify bottlenecks and take corrective action.
New Relic is another excellent choice for monitoring NGINX, providing detailed insights into your web server’s performance. Datadog also offers comprehensive reporting on NGINX usage, with an intuitive dashboard that makes it easy to get an overview of your web server’s health. AppDynamics is also a great choice for monitoring NGINX, with its user-friendly interface and powerful analytics capabilities.
Finally, SolarWinds Server & Application Monitor and Dynatrace are both comprehensive solutions designed to give you a comprehensive view of your entire IT infrastructure. These tools can provide detailed reports on everything from response times to memory utilization, allowing you to make sure everything is running optimally.
No matter which tool you choose for monitoring NGINX, the key is knowing what metrics are important for your particular environment and setting up alerts accordingly. This will ensure that any issues can be quickly identified and addressed before they become more serious problems.
Enabling NGINX Monitoring
Enabling NGINX monitoring is a simple process that involves a few steps. First, you’ll need to check if the ngx_http_stub_status_module module is enabled in your NGINX server. To do this, open the nginx.conf file and search for the following line “stub_status on;”. If it’s not present, add it at the end of the file and save it.
Next, you’ll need to restart your NGINX server in order to apply the changes made to the configuration file. This can be done using the command “sudo systemctl restart nginx” on Linux systems or “net stop nginx” and “net start nginx” for Windows systems.
Finally, once your NGINX server has been restarted, you can test whether the status page is enabled by visiting http://your-server-address/nginx-status (where your-server-address represents your web server’s address). If everything went well, you should see a page containing information about current connections and other metrics related to the performance of your web server.
Monitoring NGINX with Netdata
Monitoring NGINX with Netdata can be accomplished by utilizing the NGINX plugin. This plugin collects various metrics from NGINX such as requests, total connection time, and more. In order to use this plugin, you first need to make sure that you have the NGINX Netdata module installed. To do this, navigate to the plugins.d directory, which is usually located at /usr/libexec/netdata/plugins.d/. If this isn’t the case on your system, then open netdata.conf and add nginx in the [plugins] section of the file.
Once you have installed the plugin, you will need to switch to the netdata user (sudo -u netdata -s) and run go.d.plugin with debugging mode (-d -m nginx). This will allow you to debug any errors or issues related to your plugin configuration. After that is done, restart your Netdata service and you should be able to monitor your NGINX server performance in real time via the Netdata dashboard or API endpoints.
Monitoring Nginx for Free
Monitoring Nginx can be done for free in several ways. One way is to use SolarWinds Server & Application Monitor, which offers a free trial and allows admins to monitor the performance and availability of Nginx in real time. AppOptics APM also offers a free trial and provides visibility across applications, services, and infrastructures. Datadog APM also offers a free trial and provides detailed insights into the performance of your Nginx service. Site24x7 offers a free trial as well, allowing you to monitor uptime, response time, health check failures, and more. Sematext NGINX Monitoring also provides a free trial with features such as real-time monitoring, alerting on response time thresholds, and more. Additionally, Dynatrace offers web application monitoring capabilities that are available for Nginx as well. Finally, NGINX Amplify provides an open-source monitoring solution that is designed specifically for Nginx servers. ManageEngine Applications Manager also has an offering specifically designed for monitoring Nginx servers.

Source: grafana.com
Viewing Nginx Logs
Nginx logs are stored in the /var/log/nginx/access.log file by default, which is written in the predefined combined format. You can see these logs by opening the file with a text editor or using the command line utility ‘tail’ to view the latest entries. Additionally, you can also modify how these log entries are formatted by editing the NGINX configuration file (located at /etc/nginx/nginx.conf).
Monitoring Nginx Logs
Monitoring Nginx logs is an essential part of ensuring the performance and security of your web applications. To monitor Nginx logs, you will need to enable them in the Nginx configuration file. You can do this by adding the access_log directive to the server block. This will tell Nginx to start logging all requests made to your website. You should also specify a log_file and an optional log_format parameter. Once enabled, you can use a log management tool like Splunk or ELK stack to parse and analyze the logs for any potential issues.
Monitoring Nginx with CloudWatch
Monitoring Nginx with CloudWatch is a simple process. The first step is to attach an IAM role to the instance that you are running Nginx on. This will allow CloudWatch to authenticate and access the server.
Next, install the CloudWatch Logs Agent, which will collect your Nginx logs from all instances in your account. To do this, log into your EC2 instance and run the following command: sudo yum install -y awslogs
Once installed, configure the agent by editing the /etc/awslogs/awslogs.conf file. In this file, add a section for each log file you would like to monitor and specify the location of each log file. For example:
[/var/log/nginx/access_log]
datetime_format = %d/%b/%Y:%H:%M:%S
file = /var/log/nginx/access_log
buffer_duration = 5000
log_stream_name = {instance_id}
initial_position = start_of_file
Finally, start the agent by running the command “sudo service awslogs start” and verify that it is running correctly by running “sudo service awslogs status”. Once configured correctly, CloudWatch will begin monitoring your Nginx logs in real-time and you can view them through the CloudWatch console or API calls.
The Purpose of NGINX
The purpose of NGINX is to provide a high-performance web server that is reliable, secure, and simple to configure. It is designed for maximum uptime and scalability, allowing websites to handle large amounts of traffic without becoming overloaded. NGINX can also be used for reverse proxying, caching, load balancing, and media streaming. Additionally, it provides various security features such as access control, rate limiting, and TLS/SSL encryption for secure data transfer. Its modular architecture allows users to customize the software according to their needs. All in all, NGINX provides a powerful web server solution with many features and flexibility.
Conclusion
In conclusion, NGINX is a powerful and reliable web server that can be monitored using various tools to ensure it is running optimally. There are several free options such as the ngx_http_stub_status_module module and Prometheus and Grafana, as well as paid solutions such as New Relic, Datadog, AppDynamics, SolarWinds Server & Application Monitor, and Dynatrace. Each of these monitoring tools offers different features and capabilities so it is important to assess the needs of your organization and choose the best tool for your particular situation. With proper monitoring in place, you can be sure that your NGINX web server is running smoothly and efficiently.


