Monitoring your Java Virtual Machine (JVM) is an important part of ensuring that your applications are running as efficiently and reliably as possible. JVM monitoring can help you understand how your applications are performing, identify potential problems, and take corrective action before they become major issues.
In this blog post, we will discuss what JVM monitoring is, why it’s important, and the key metrics for monitoring JVM performance.
JVM monitoring is the process of observing and analyzing the performance and operation of a Java Virtual Machine (JVM). This includes collecting data on memory usage, CPU usage, thread count, garbage collection activity, and other metrics. This data can be used to identify issues with your application’s performance or operation.
Monitoring your JVM helps you detect problems with your applications before they become major issues. It also allows you to analyze the performance of your applications over time so you can compare different versions or different deployments in order to improve their efficiency. Additionally, JVM monitoring helps ensure that your system is using its resources efficiently by providing visibility into how much memory or CPU is being used at any given time.
There are several key metrics that you should monitor when assessing the performance of a Java Virtual Machine:
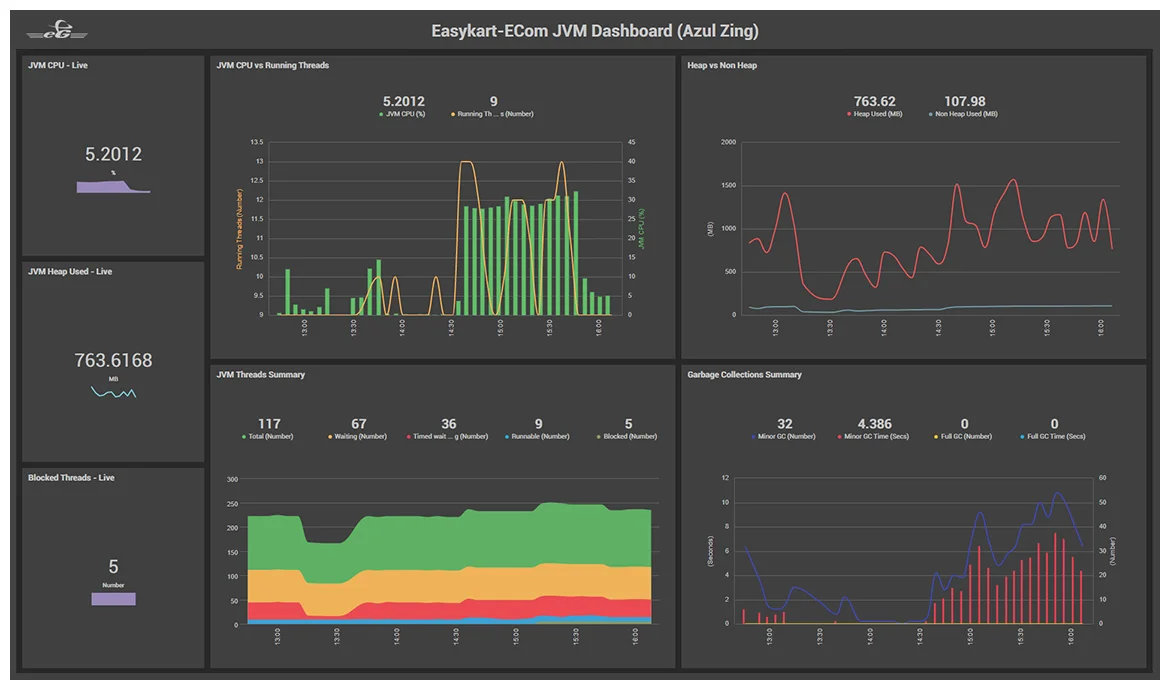
– Heap Memory: Heap memory is the memory space that holds all the objects in your application. By tracking heap memory usage over time, you can identify potential memory leaks or other problems that could lead to poor application performance.
– Garbage Collection (GC): Objects created in heap memory become unreferenced after serving their purpose. GC monitors these objects and reclaims them for reuse when necessary and frees up space for new objects to be created. Monitoring GC activity helps you track down performance issues due to inefficient garbage collection or excessive object creation/destruction in an application
– Threads: Threads are responsible for serving user requests. Tracking thread count lets you see how many requests are being handled at any given time and whether there are any bottlenecks due to too many threads running at once or not enough threads available to handle incoming requests quickly enough.
– JMX Agents: The Java Management Extensions (JMX) API provides a standard way for monitoring Java applications using out-of-the-box management tools known as “JMX agents”. These agents allow you to observe various metrics related to how well a given application is performing such as response time and throughput as well as more detailed information about what’s happening under the hood such as object allocation rates or CPU usage per thread or request type.
Monitoring these key metrics can help you ensure that your applications are running smoothly and efficiently on a Java Virtual Machine (JVM). So make sure to keep an eye on these metrics when assessing the performance of your applications!

Monitoring Java Virtual Machine Performance
Monitoring the Java virtual machine (JVM) is an important part of keeping your application server running optimally and troubleshooting performance issues. To monitor the JVM on WebSphere Application Server, you will first need to log in to the Admin console. From there, click Servers > Server Types > Websphere application servers and select your server. Then click Java and Process Management > Process definition. Under the additional properties section, select Java Virtual Machine.
You can then view several metrics related to JVM performance, such as Heap Size, Maximum Heap Size, PermGen Size, Thread Stack Size, and Garbage Collection Strategy. You can also adjust these settings if necessary. Additionally, you can use a tool such as jstat or jvisualvm to monitor the JVM from outside of WebSphere.
Checking JVM Performance
Checking JVM performance can be accomplished through a variety of methods. One way to monitor your JVM performance is to track the heap memory usage. This can be done by tracking the amount of memory that is being used by objects in your application. Another important metric for monitoring JVM performance is garbage collection (GC). GC tracks the number of objects that are unreferenced after serving their purpose and the time taken for them to be released from memory. Lastly, it’s important to monitor your threads, as they are responsible for serving user requests. Tracking thread usage can help you identify any bottlenecks that might be causing slowdowns in your application. You can also use profiling tools such as VisualVM and Java Mission Control to observe and analyze different aspects of your JVM performance such as memory consumption, thread activity, garbage collection data, and more.
Understanding JVM and JMX
JVM (Java Virtual Machine) is the engine that runs Java applications. It is responsible for interpreting and executing code written in the Java programming language. JMX (Java Management Extensions) is a standard API for the management and monitoring of JVM-based applications. It provides access to the instrumentation built into the JVM, allowing developers to manage and monitor their applications using an out-of-the-box management tool, or JMX agent. With it, developers can view usage statistics, set alerts on performance thresholds, analyze thread usage and memory allocation, and much more. This makes it easier for developers to create robust, stable applications with fewer resources.
The Role of the Java Virtual Machine
The Java Virtual Machine (JVM) is the core of the Java programming language. It performs a number of important tasks, including loading, verifying, and executing Java bytecode. When a program is written in Java and compiled, the output is a file containing Java bytecode. This bytecode can then be loaded and executed by the JVM.
The JVM’s primary job is to ensure that any code it executes conforms to the rules of the Java language and its associated libraries. To do this, it verifies each instruction in the bytecode before executing it, making sure that only valid instructions are run. Additionally, it ensures that any data used by the program is valid according to the rules of Java’s type system.
In addition to verifying and executing code, the JVM also provides other features such as memory management and garbage collection. This helps ensure that programs running on the JVM have access to enough memory while not wasting resources on stale data or objects that are no longer in use.
Overall, without the JVM, running programs written in Java would be impossible as it provides an environment for programs written in this language to run safely and efficiently.
Monitoring JVM Heap Usage
Monitoring JVM Heap Usage is an important aspect of ensuring that your application performance is optimized. To monitor your JVM Heap Usage you can use a commercial APM (Application Performance Management) tool such as CA Wily APM, AppDynamics, New Relic, Riverbed, etc. These tools allow you to set thresholds to alert you when the heap usage of your application exceeds certain limits. Additionally, they provide detailed reports on memory usage and garbage collection activity so you can identify any potential issues with your application’s heap utilization. With these tools, it’s also possible to track historical trends in your heap usage and gain insights into how your application is performing over time. Finally, some of these tools also offer recommendations for how to improve the efficiency of your application’s memory utilization.
Checking If the JVM Is Running
In order to determine if the Java Virtual Machine (JVM) is running on your system, you can use the Java Virtual Machine Process Status (jps) tool. This tool will scan your system for each instance of the JVM and provide a list of any processes that are currently running. You can also use the ps command to view running Java processes, along with piping output to grep. If neither of these commands returns any active JVM processes, then it is safe to assume that the JVM is not currently running on your system.
Monitoring JVM Using JMX
To monitor your Java Virtual Machine (JVM) using JMX, you must first enable and configure the ready-to-use JMX agent that comes with your Java installation. This is done by setting certain system properties when you start the Java VM on the command line. You can set these properties using the following syntax: java -Dproperty=value …
Once the JMX agent has been enabled, you can use it to monitor the activity of your JVM. It will give you access to a wide range of metrics related to memory usage, thread count, CPU load, garbage collection, class loading, and more. Additionally, you can control the behavior of your JVM remotely by setting various attributes or issuing commands through the same agent.
Using JMX will give you great insight into how your application is performing and help identify potential areas for improvement or optimization.
Understanding JMX Monitoring
JMX monitoring works by connecting to a JVM port and querying data from the Managed Beans (MBeans) exposed via the JMX console. Each MBean represents a resource running inside the JVM and provides information such as its configuration and usage. The data retrieved from these MBeans can then be used to provide insight into the performance of the application, diagnose problems, and optimize system resources.
To monitor an application, a JMX monitoring tool must be configured to connect to the JVM port and query for the desired MBeans. Once connected, the monitoring tool can collect data from all of the MBeans associated with the application. This data can then be used to create metrics and alerts, which can be used to detect potential issues before they become a problem. Additionally, this data can be used to analyze performance trends over time and identify areas where improvements can be made in order to optimize system resources.
Conclusion
In conclusion, monitoring the Java Virtual Machine (JVM) is an important task for any Java-based application. It involves analyzing key metrics such as heap memory, garbage collection, threads, and performance to ensure the application is running optimally. JMX is a standard API that can be used to monitor and manage the JVM and its applications. Providing detailed information about how the JVM operates, it allows developers to identify any potential issues and address them before they become a problem. With careful monitoring of the JVM, developers can ensure their applications run at peak performance.


