Are you a Mac user who needs to access developer tools? Developer tools are essential for web developers, as they allow you to monitor and debug your code. Whether you are a novice or an experienced programmer, it is important to understand how to open and use developer tools on your Mac.
The first step in accessing developer tools on your Mac is enabling the Develop menu. To do this, open Safari > Preferences > Advanced > Show Develop menu in the menu bar. Once this option is enabled, the Develop menu will appear between Bookmarks and Windows in the Safari menu.
The most useful options within the Develop menu are Open Page With, User Agent, and Empty Caches. Open Page With allows you to view webpages with different web browsers such as Firefox or Chrome. This is especially useful for testing websites across different browsers. The User-Agent option lets you change the user-agent string of your browser to simulate other devices or browsers. This can be beneficial for debugging cross-browser compatibility issues. Finally, Empty Caches clears all cached images and data from any web pages that have been visited recently in Safari.
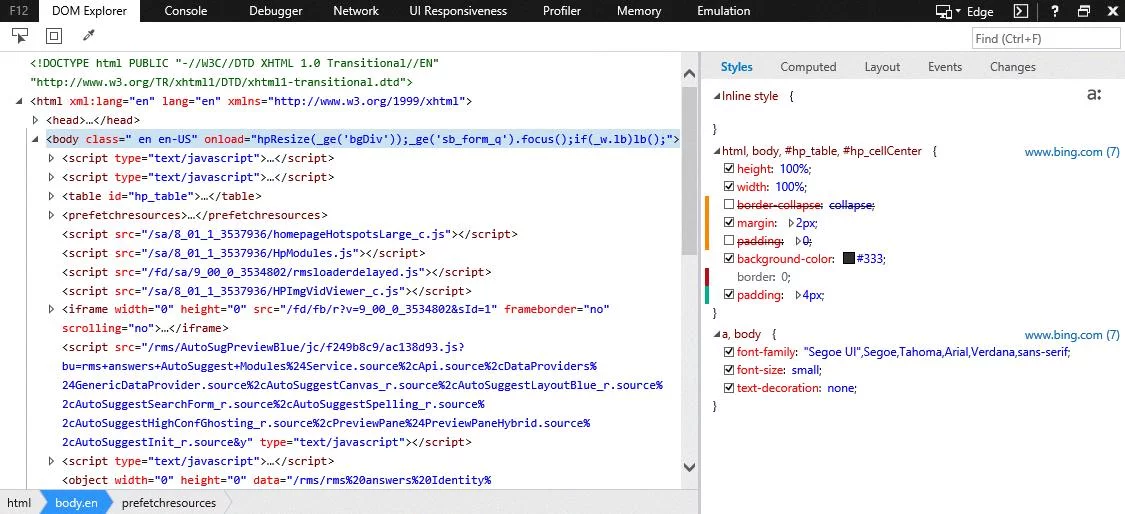
Another way of opening developer tools on a Mac is via keyboard shortcuts. Most browsers support F12 as a shortcut to open dev tools; however, Internet Explorer and Edge require Ctrl + Shift + I instead. Additionally, for Firefox users, pressing and holding/right-clicking any item on a webpage (Ctrl-click on the Mac) will bring up a context menu from which you can select Inspect Element to open dev tools.
Whether you are developing a website or troubleshooting existing code, it is important to know how to access developer tools on your Mac quickly and easily so that you can get the job done efficiently!

Source: mspoweruser.com
Bringing Up Developer Tools on Mac
To bring up Developer Tools on Mac, open the Safari browser and go to the menu bar. You should see a “Develop” menu. If not, select Safari > Settings, click Advanced, and make sure to check the box for “Show Develop menu in the menu bar.” Once the Develop menu is visible, click on it and select “Show Web Inspector” or “Show Error Console.” This will open up a window with a range of tools you can use to debug and test your website for compatibility with web browsers.
Accessing F12 Developer Tools on a Mac
In order to get F12 Developer Tools on your Mac, you will need to open up System Preferences > Keyboard. Once there, check the box marked “Use all F1, F2, etc. keys as standard function keys”. Then head to the Shortcuts tab, and select App Shortcuts from the side menu. From here, you can add a shortcut for Chrome Developer Tools by clicking the “+” button and entering “Chrome” into the Application field. Select Chrome from the drop-down list that appears and then types in “F12” in the Keyboard Shortcut field. After this is done, you should be able to open Chrome Dev Tools with just F12 on your Mac.
Opening Developer Tools
To open Developer Tools, you can use your keyboard, menu bar, or context menu. On most browsers, you can press the keyboard shortcut Ctrl + Shift + I to open Developer Tools. If you’re usng Firefox, you can go to the Menu bar and select “Tools” and then “Web Developer.” If you’d prefer to use the context menu, press-and-hold/right-click an item on a webpage (Ctrl-click on Macs), and select “Inspect Element” from the context menu that appears. If you’re using Internet Explorer or Edge, the keyboard shortcut is F12.
Opening the Developer Tab in Safari
To open the Develop tab in Safari, you first need to enable it. To do this, go to the Safari menu and select ‘Preferences’. In the Preferences window, select ‘Advanced’ and then check the box next to the ‘Show Develop’ menu in the menu bar’. Once you have enabled the Develop tab, it will appear between Bookmarks and Windows in the Safari menu.
Once you click on Develop, you will be able to access some of its most useful options such as ‘Open Page With’, ‘User Agent’, and ‘Empty Caches’. With Open Page With, you can test what a web page looks like when opened with a different browser or device. User Agent allows you to view a web page as if it was being viewed by another type of device (e.g. iPhone or Android). Finally, Empty Caches allows you to delete any stored website data from your computer.
Opening Developer Tools in Chrome on Mac
To open the Developer Tools in Chrome on Mac, open the Chrome Menu in the upper-right-hand corner of the browser window and select More Tools > Developer Tools. Alternatively, you can use the keyboard shortcut Option + ? + J to open the Developer Tools. Once opened, you will have access to multiple panels that allow you to inspect HTML and CSS elements on a web page, view console messages, view logged network requests, and profile JavaScript performance.
Inspecting on Mac
If you’re using a Mac, you can inspect elements on a webpage by right-clicking the page and selecting ‘Inspect Element’. Alternatively, you can press Command+Option+i on your keyboard to open the same inspection window. This will open up a new window that displays all the HTML and CSS associated with the page. From here, you can view and edit elements of the page, as well as view any errors in your code. You can also use this window to find out more about how the page is structured and how it works.
Conclusion
Developer tools are essential for web developers, as they provide the necessary tools and information to ensure their websites are working correctly and meeting all standards-based web browser requirements. With the Safari Develop menu, developers can open Chrome Dev Tools with just F12 on a Mac, access Firefox’s menu bar, use the context menu for inspecting elements, and more. Additionally, important developer options such as Open Page With, User Agent, and Empty Caches can be found in the Safari Develop Menu. With these tools at their disposal, developers can easily debug their websites and create optimized user experiences.


