Are you looking for a quick and easy way to create a graph on Excel Mac? Well, you’ve come to the right place! In this blog post, we’ll show you exactly how to make a graph on Excel Mac in just a few simple steps.
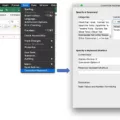
First, you’ll need to select the data you want to chart. To do that, click the Insert tab in your Excel Mac window. From there, you can either click Recommended Charts and select the type of chart you want or click a specific chart type and choose the style that best fits your data.
Once your chart is selected, it’s time to customize it. To do this, click on Chart Design located at the top of your window. From here, you can add titles and subtitles to your chart or change the layout or style of your graph. You can even add trendlines or gridlines if desired.
Finally, when your graph is complete, it’s time to save it. Click File > Save As and name your chart appropriately. You can save it as an image file such as .png or .jpg so that others can view it without having access to Excel Mac software.
Now that you know how to create a graph on Excel Mac, why not give it a try? With just a few clicks of the mouse, you can transform boring data into visually appealing charts in no time at all!
Creating a Graph from Excel Data on a Mac
To make a graph from Excel data on a Mac, you need to first select the data you want to chart. To do this, open your Excel spreadsheet and highlight the cells with the data you want to use. Then click the Insert tab at the top of the window. You can then either select one of the Recommended Charts or click a specific chart type and choose the style you would like to use. Lastly, click Insert and your graph will be generated in your worksheet.
Creating a Graph from Excel Data
Creating a graph from Excel data is easy and straightforward. First, select the data you wish to visualize. Then, click on the INSERT tab in the ribbon menu and select Recommended Charts. A list of recommended charts based on your data will appear, so you can quickly find one that works best for your needs. You can also preview any chart by clicking on it to see how your data looks as a graph. Once you have chosen the graph you want, click OK and the graph will be generated and ready for you to customize as needed.
Creating Graphs on Mac
Yes, you can make a graph on Mac using Apple’s Numbers app. With Numbers, you can create various types of charts such as column, bar, line, area, pie, donut, and radar charts. To add any type of chart to your sheet first, select the table cells with the data you want to use. Or, you can select the data first and then create a chart that displays the data. Once your chart is complete, you can customize it with different colors and fonts to make it more visually appealing.
Opening a Chart Template in Excel for Mac
To open a chart template in Excel for Mac, first, click on the Chart Design tab on the ribbon. Then, click Change Chart Type > More Options. You’ll see a dialog box with a drop-down menu that says “Chart Templates.” Select this option and then select your desired template. Once you’ve selected it, click OK to save it and apply it to your chart. You can also access templates from the Insert tab on the ribbon by clicking Chart > Templates and selecting your desired template.

Source: ganttexcel.com
Creating a Graph from a Data Table
Making a graph from a data table is relatively simple. First, gather the data from the table and organize it into two columns: one for the independent variable (the x-axis) and one for the dependent variable (the y-axis). Then, plot each point on a graph using the appropriate coordinates. Finally, join all of the points with a straight line and add arrows on both ends to show that the line continues beyond what can be seen on the graph.
Conclusion
Creating a graph on Excel Mac is a simple and efficient way to visualize your data. With just a few clicks of the mouse, you can select the data you want to chart, choose from one of the recommended charts, or create your own custom chart, and view the graph in your worksheet. With its easy-to-use features and intuitive design, Excel Mac makes it easy to create beautiful visuals that will help you easily understand and present your data.


