If you are a database administrator or a developer looking to improve the performance of your SQL Server databases, then you need to consider using a SQL Server monitoring tool. With the right tool, you can easily identify and fix issues that may be impacting your database’s performance or stability.
Monitoring tools are essential for keeping track of your server performance and identifying problems before they cause major disruptions in service. By leveraging these tools, you can identify and fix potential issues quickly and efficiently.
One of the most important aspects of using a monitoring tool is being able to monitor both server metrics and server logs. This allows you to get an accurate understanding of how your server is performing in real time so that you can take appropriate action as soon as any potential issues arise.
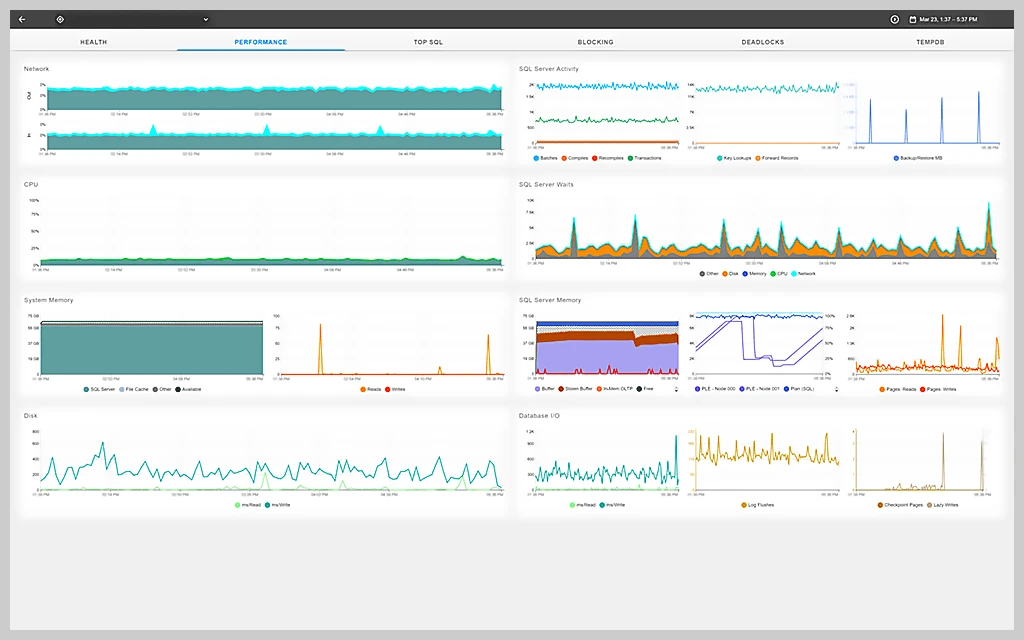
Fortunately, there are several options available when it comes to SQL Server monitoring tools. One popular option is SQL Monitor from Microsoft which is free to use with Microsoft’s SQL Server Management Studio. This software is great for tracking and analyzing server performance in real-time. It also provides modules for Replication Monitor and Database Mirroring Monitor which enable administrators to easily keep track of these activities within their databases.
Another great option is Dynatrace, which offers both SaaS and on-site models for server performance monitoring solutions. With its ability to track both server metrics and logs, Dynatrace should be suitable for most monitoring needs that may arise in your environment.
Ultimately, having an appropriate monitoring solution in place will make managing your database more efficient and help ensure that any potential issues with your servers are identified quickly so that they can be addressed promptly before they cause any major disruptions of service. So if you don’t already have one installed on your system, it’s definitely worth considering investing in one!

Benefits of Using a SQL Server Monitoring Tool
SQL Server Monitoring Tool is an add-in for Microsoft SQL Server Management Studio, which allows you to keep track of and analyze SQL Server performance in real-time. It provides a comprehensive overview of your server’s activity and helps to identify any potential problems or issues so that they can be addressed quickly. With this tool, you can monitor the performance of various components, including memory usage, CPU utilization, disk I/O, transactions per second, query execution times, and more. Additionally, it also allows you to set up alerts so that you can be notified when a certain threshold is reached or when there are changes in performance levels. This makes it easier to take corrective action as soon as possible and prevents any further performance issues. Overall, SQL Server Monitoring Tool is a great way to monitor your server’s performance and ensure that it is running optimally at all times.
Monitoring SQL Server
Monitoring SQL Server is essential for maintaining the performance and stability of your database. You can monitor SQL Server with various tools, such as SQL Server Management Studio, Activity Monitor, and the Query Store.
Using SQL Server Management Studio, you can view the SQL Server Error Log to monitor significant server events and errors. Activity Monitor allows you to view system performance metrics such as active sessions, CPU usage, and memory usage. You can also use the Query Store to monitor query performance over time. The Query Store stores query execution plans so that you can identify queries that have degraded performance and investigate potential causes.
In addition to these tools, there are other third-party monitoring solutions available that can provide more detailed insights into your database performance. By monitoring your SQL Server regularly, you can ensure that your database is running optimally and identify potential problems before they become major issues.
Monitoring and Optimizing SQL Server Performance
To monitor and optimize SQL Server performance, it is important to follow a 5-step process.
The first step is to determine your monitoring goals. This will help you clarify the reasons why you are monitoring the system so that you can tailor your performance-tuning strategy to meet these goals.
The second step is to choose an appropriate tool for monitoring and optimizing your SQL Server. There are many different tools available on the market, so be sure to select one that best fits your needs and budget.
The third step is to select components and metrics that need to be monitored in order to ensure optimal performance. This includes things like CPU utilization, memory usage, disk I/O, network latency, and more. It is important to take into account any server-specific factors that could affect performance when selecting components and metrics.
Once the components and metrics have been selected, it’s time for the fourth step: monitor the database. This involves running tests on the system at regular intervals in order to collect data about how it is performing over time or under certain conditions (such as peak usage times). This data can then be used to identify areas of improvement or potential issues with the system’s performance.
Finally, once all of the data has been collected, it’s time for the fifth step: analyze this data in order to determine what areas of optimization can be addressed or improved upon. By taking a look at where performance bottlenecks exist or where resources are being wasted, it’s possible to make changes that will ultimately lead to better overall performance from your SQL Server system.
Conclusion
In conclusion, SQL Server monitoring tools are essential for ensuring the health and performance of a SQL Server system. With the right tool, businesses can monitor server performance in real-time, track and analyze errors, view activity logs, and more. Dynatrace is a particularly powerful tool for those who need comprehensive monitoring capabilities. No matter which tool you choose, having the right server monitoring tool will allow you to maximize your system’s efficiency and keep it running smoothly.


